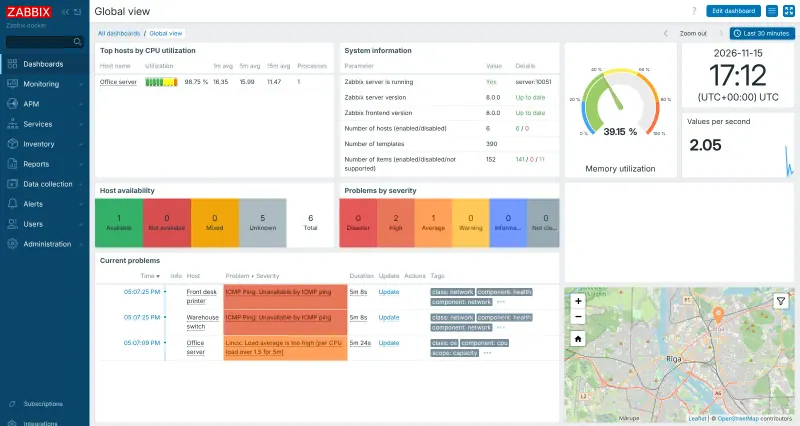
There is no import from Datadog, so you set Zabbix up afresh and run both side by side for a while. Sign in as Admin, change the password, and add your alert channels first, such as email, Slack or Microsoft Teams. Install the Zabbix agent on each server you watch and link it to the matching template, such as Linux or Windows by Zabbix agent, so its checks and alerts come ready-made. Rebuild the few dashboards your team relies on, compare alerts with Datadog for a week or two, then retire the Datadog agents.
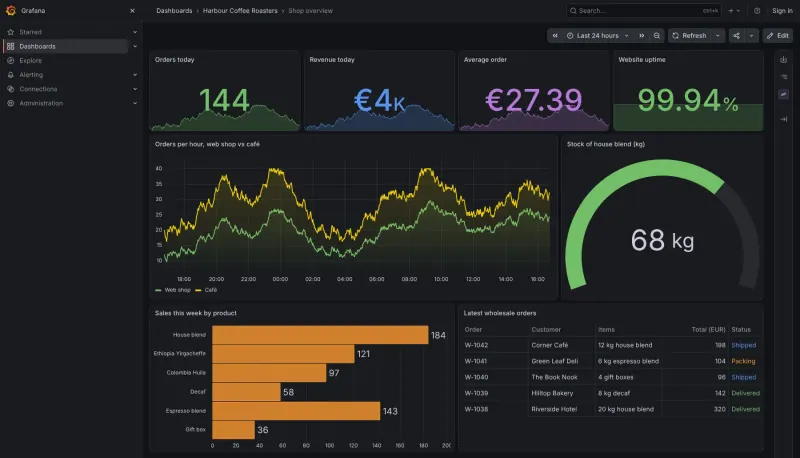
Grafana collects no data itself, so start with where your data will live: a store such as Prometheus for metrics or Loki for logs, or a database you already have, which can sit next to Zabbix, since Grafana can also show Zabbix data through a community plugin. Add it as a data source, import a ready-made dashboard from grafana.com for the software you run, and recreate your most important Datadog monitors as Grafana alert rules.
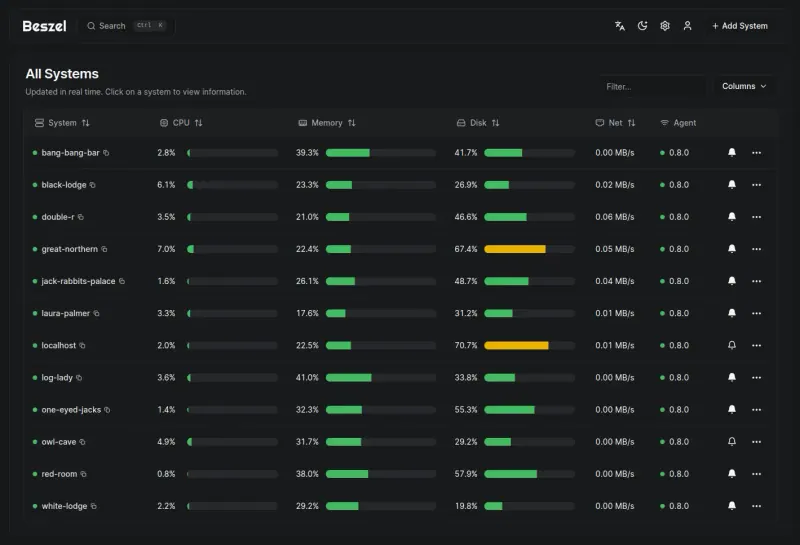
Nothing carries over from Datadog, but Beszel takes little setup. Create your admin account, then for each server choose Add system and run the short install command Beszel gives you, the same way you installed the Datadog agent; the agent runs on Linux, FreeBSD, macOS, Windows and in Docker. Recreate the alerts you rely on, such as a server going down or a disk filling up, and set up email or a chat webhook for them. Once Beszel shows every server, remove the Datadog agents. If you also used Datadog for logs, tracing or website checks, you need a separate tool for those.
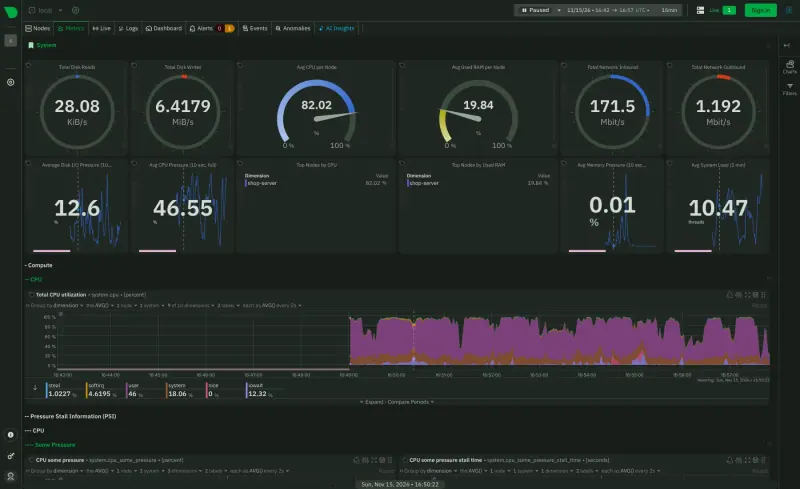
Nothing needs to move to Netdata either: it finds what to measure on its own, so there are no dashboards or agents to bring over. Open Netdata's address, sign in with the username admin and the password Cloudgate shows, and skip the offer to sign in to Netdata Cloud if you don't want an account. The built-in alerts start at once; to have them sent by email, Slack, Telegram or PagerDuty, set up notifications in Netdata's configuration.