
Grafana
Dashboards and alerts for your servers, apps and data.
No server needed to start: Cloudgate can provide one. What happens when you click Deploy
What is Grafana?
Self-hosted Grafana turns your server metrics, logs and databases into live dashboards, with alerts by email, Slack or Teams when a number goes wrong.
Self-hosted Grafana is free, open-source dashboard software that turns your server metrics, logs and databases into live charts and alerts, an alternative to paying Datadog or New Relic for dashboards. It does not store data itself: it reads from the places your numbers already live and puts them side by side on one screen.
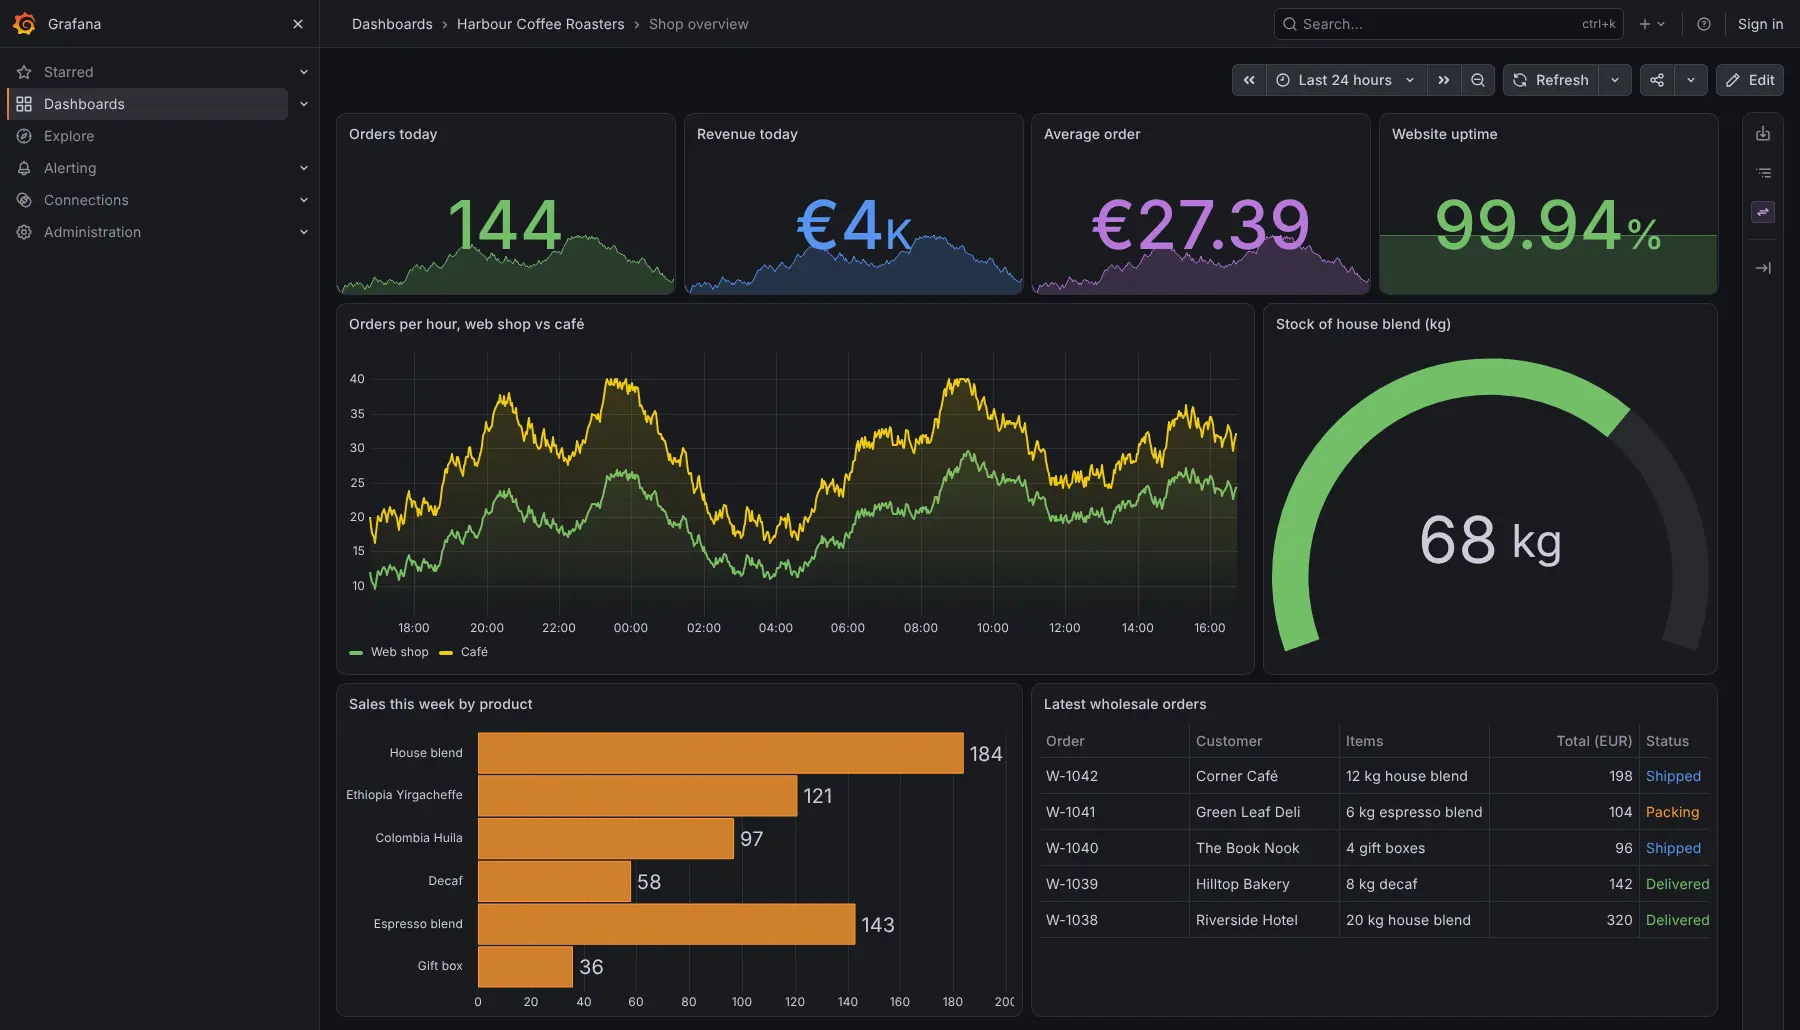
You connect a data source, such as a monitoring database like Prometheus or your own PostgreSQL or MySQL database, then build a dashboard or import a ready-made one. A coffee roaster, for example, could show orders per hour from its online shop, stock levels and website uptime on a screen in the roastery, and get a Slack message when stock of its house blend runs low.
Alerts can go to email, Slack, Microsoft Teams, Telegram and other services. Dashboards also work in a phone's browser. Some connectors, PDF reports and fine-grained permissions are part of the paid Grafana Enterprise edition and are not included.
Cloudgate installs Grafana on a server Cloudgate provides or one you connect, and gives it a secure web address. Sign in as admin with the password Cloudgate generated, then add your first data source.
What you can do with Grafana
- Build live dashboards Line charts, bar charts, gauges, big numbers, tables and heatmaps that refresh on their own.
- Put all your data on one screen Mix several data sources in one dashboard, even in the same chart.
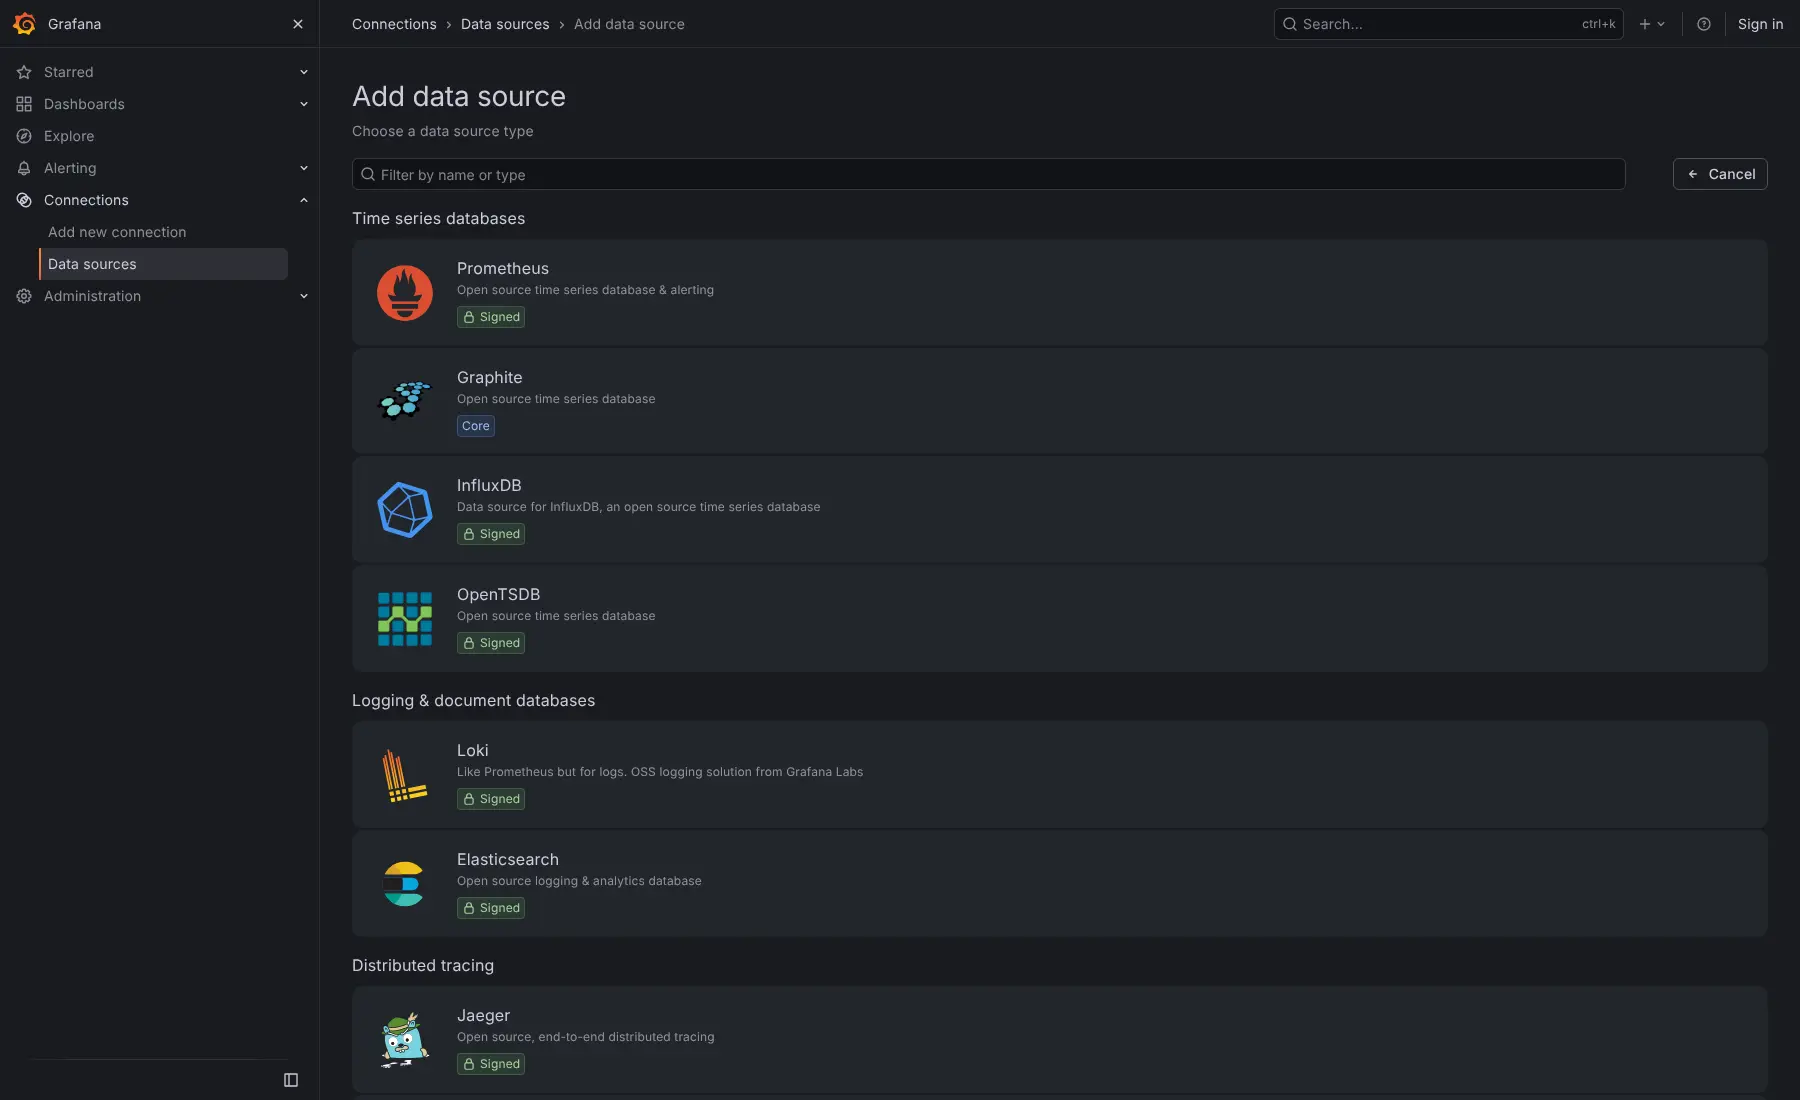
- Connect the data you already have Built-in connections for Prometheus, InfluxDB, Graphite, Loki, Elasticsearch, PostgreSQL, MySQL, Microsoft SQL Server and the AWS, Azure and Google Cloud monitoring services.
- Get an alert when a number goes wrong Set alert rules on any chart and get notified by email, Slack, Microsoft Teams, Telegram, Discord, PagerDuty or a webhook.
- Dig into a problem Explore lets you run quick queries, compare time ranges side by side and jump from a spike in a chart to the matching logs.
- Switch views with dropdowns Dashboard variables add dropdowns at the top, so one dashboard can show any server, shop or region.
- Share with your team Invite people as viewers, editors or admins, and organize dashboards into folders.
Replaces Datadog
Grafana does the same job as Datadog. Here is what changes when you switch.
- No bill per server, user or gigabyte of data, only your own server
- Your metrics and dashboards stay on your own server
- One screen for many data sources, including your own databases
- A large library of ready-made dashboards you can import
- Grafana shows and alerts on data but stores none itself, so you also need a monitoring database or log store
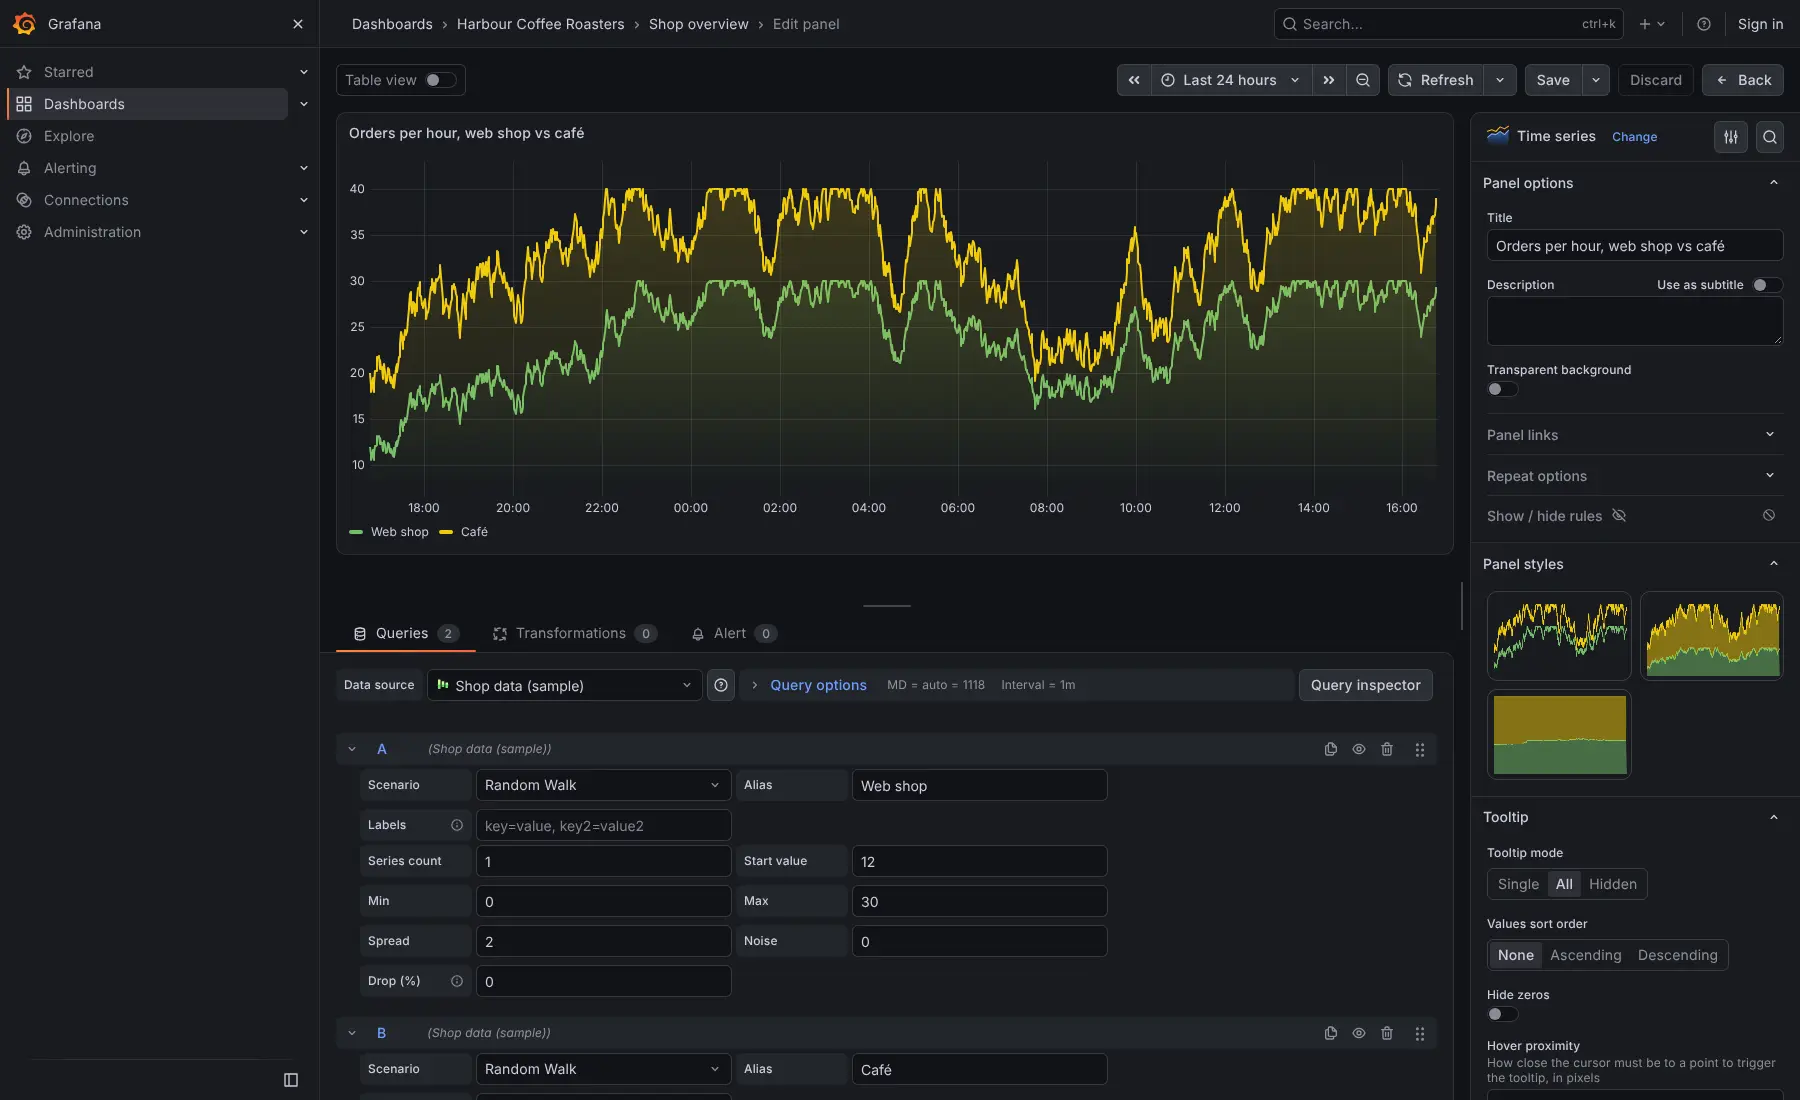
- Building charts means writing queries, though imported dashboards save most of that work
- Connectors for Datadog, Splunk, New Relic and Snowflake, PDF reports and fine-grained permissions are in the paid Enterprise edition only
- Your Datadog dashboards and history do not move across
What happens when you click Deploy?
You do not need a server or any technical knowledge. Four steps, and Grafana is running at its own web address.
- Step 1 Click Deploy and create your account
Deploy takes you to Cloudgate. Create an account, or log in if you have one. Grafana itself is free.
- Step 2 Choose a server
No server? Get one from Cloudgate: pick a size and a country, and Cloudgate gets it ready. Already have one? Connect it instead.
- Step 3 Cloudgate sets up Grafana
It prepares the server, makes the passwords the app needs and starts it. There is nothing to install and nothing to write down.
- Step 4 Open your app and sign in
Your app gets a free web address to start, without https. Add your own domain, like app.yourshop.com, and Cloudgate secures it with https for you.
New to Cloudgate? See what Cloudgate is
Run Cloudgate yourself? Deploy from your own console
In your Cloudgate console, open Templates and choose Grafana.
Questions
Is Grafana free?
Yes, Grafana OSS is free and open source under the AGPL-3.0 licence, with no limit on users or dashboards. Grafana Labs also sells Grafana Enterprise and Grafana Cloud, which add paid features such as PDF reports and extra connectors.
Is Grafana a good alternative to Datadog?
Yes, for dashboards and alerts, if you are happy to run the data collection yourself. Datadog collects and stores your metrics and logs for you; Grafana shows and alerts on data kept in tools such as Prometheus, Loki or your own database.
How do I sign in to Grafana the first time?
Sign in with the username admin and the password Cloudgate generated for the app, shown in its settings in Cloudgate. You can change the password later from your Grafana profile.
What data can Grafana show?
Grafana shows data from monitoring databases such as Prometheus, InfluxDB and Graphite, logs from Loki or Elasticsearch, cloud monitoring from AWS, Azure and Google Cloud, and SQL databases such as PostgreSQL, MySQL and Microsoft SQL Server. More connections are available as plugins.
Can Grafana send alerts to Slack or email?
Yes, Grafana alerts can go to email, Slack, Microsoft Teams, Telegram, Discord, Google Chat, PagerDuty, Opsgenie and webhooks. You choose who gets which alert.
Can I move my Datadog dashboards to Grafana?
No, the free Grafana does not import Datadog dashboards or data; the Datadog connector is part of the paid Enterprise edition. You rebuild your dashboards in Grafana, often starting from a ready-made one in Grafana's dashboard library.
What server size do I need for Grafana?
A small server is enough for a small team, because Grafana's project recommends 2 CPU cores and 2 to 4 GB of memory for fewer than 25 people using it at once. That covers Grafana only, not the databases it reads from.
Do I need technical skills to run Grafana?
No. Click Deploy, create your Cloudgate account and choose a server, and Cloudgate sets up Grafana and gives it a web address. You use it in your browser like any other online tool.
Do I need my own server for Grafana?
No. When you deploy Grafana, hosted Cloudgate can provide a server. If you already rent one, you can connect it instead.
Related apps

Dashboards and a SQL editor on your own databases.

Dashboards on your PostgreSQL or ClickHouse data.

Self-hosted BI on the metrics your dbt project defines once.

Turn your business data into charts your whole team can use.